Friday, September 9, 2011

Glycemic control in patients with early onset autosomal dominant type 2 diabetes.


Rachael R. Irving1, James L. Mills1, Eric G. Choo-Kang2 , Anthony Mullings3, Errol Y Morrison1, Rosemarie Wright-Pascoe4, Wayne Mclaughlin1 .
1  Department of  Basic Medical  Sciences, University  of the West Indies,  
  Kingston, Jamaica.
2 Department of Pathology, University of the West Indies, Kingston, Jamaica.
3  Department of Gynaecology, Obstetrics and Child Health, University  of
   the West  Indies, Kingston, Jamaica.
4  Department of Medicine, University  of the West Indies, Kingston, Jamaica.

Abstract

Background : Many studies support a correlation between glycemic control and diabetes complications in patients with type 2 diabetes.  Epidemiological analysis showed a continuum between risk of cardiovascular complications and glycemia, so that for each percentage point decrease in HbA1c there was a twenty five percent reduction in diabetes related death.  Studies showed that persons affected by diabetes who understand the risk for, and implications of the complications of the disease are more likely to have better glycemic control and outcome.
Aim : To determine the levels of glycemic control in persons with early
 onset autosomal dominant type 2 diabetes.
Methods : Eighty nine affected individuals from families with early onset autosomal dominant type 2 diabetes were assessed for levels of glycemic control.  Glycemic control each three months, for a period of twelve months was monitored by HbA1c. Patient’s  demographic and anthropometric data, adherence to treatment plan and attendance  patterns at clinics were also assessed.
Results:  The significant changes in mean HbA1c in the 89 affected individuals from baseline to 12 months followed a linear pattern ( 12.3± 1.2% at 0 month , 12.3±1.6% at 3 months, 12.0±1.0% at 6 months, 11.7±0.9% at 9 months, 11.4±1.7% at 12 months, p <0.005).  There was no statistically significant difference in HbA1c from baseline to 12 months  for the different patterns of adherence to treatment plan however those with  excellent adherence to treatment  had a steeper decreased in HbA1c from baseline to 12 months (excellent adherence: HbA1c decreased 1.9% over 12 months, poor adherence : HbA1c decreased 1.08 % over 12 months).  There was no statistically significant difference in HbA1c between those with poor or moderate patterns of attendance at clinics however when the comparison was made between those with poor and excellent attendance, the statistical difference was significant (p<0.05).  Patients with excellence attendance had the greatest decreased in HbA1c from baseline to 12 months (12.2±4.4% at baseline to 8.9±3.0% at 12 months, p <0.05).
Conclusion
Adherence to treatment plan and attendance at clinics enhance reduction in HbA1c.

Introduction

Early onset autosomal dominant type 2 is increasingly occurring in families of African descent (1). This type of diabetes is characterized by insulin resistance, dyslipidemia, and a high risk of long term complications (1-2). Early onset autosomal dominant type 2 is usually diagnosed in persons aged < 35 years(2) as compared to classical type 2 diabetes diagnosed in persons 45 years(3).  Development of the disease at an earlier age increases the risk of duration dependent complications such as cardiovascular disease. In the United States of America  type 2 diabetes contributes to more cases of adult-onset loss of vision, renal failure, and amputation than any other disease(4).
    Glycemia, can be measured most reliably with the glycosylated hemoglobin assay (HbA1c). HbA1C value indicates glycemic control over a 2 to 3 months period; values less than 7% are considered optimal (7).There is substantial evidence that improving glycemic control decreases the risk of microvascular complications (5-6).  Epidemiological analysis showed a continuous association between the risk of cardiovascular complications and glycemia, such that for every percentage point decrease in HbAlc (e.g., 9 to 8%), there was a 25% reduction in diabetes-related deaths, a 7% reduction in mortality rate, and an 18% reduction in combined fatal and non-fatal myocardial infarction (5,8). Tight glycemic control has been shown to prevent the onset or progression of diabetic nephropathy in type 2 diabetic patients (5-6 ).
    Adherence to treatment plan which include dietary intake, proper blood pressure, lipid and glucose monitoring are fundamentals for proper glycemic control and reduction in risks of complications related to diabetes(8). In this study demographic and anthropometric data, treatment adherence and attendance patterns at clinics in relations to glycemic control over 12 months of 89 individuals with early onset autosomal dominant type 2 diabetes are presented.
To our knowledge this is one of the first investigations that evaluates glycemic control as it relates to adherence to treatment plan and clinic attendance in a homogenous population of persons with early onset autosomal type 2 diabetes
Statistics :
    Data was analyzed by using SPSS 12.2 (SPSS Inc. in Chicago). Demographic variables were analyzed using Spearman’s correlation coefficient. Correlation regression was used to access multiple relationships. The associated t and ANOVA tests were done to test the statistical significance of the correlation coefficient and regression models reported.

Methods


    Patients with early onset autosomal dominant type 2 diabetes were recruited for the study on glycemic control.  General practitioners were asked to refer affected patients with a family history of early onset type 2 diabetes to the testing centre: the Department of Basic Medical Sciences, University of the West Indies, Mona, Jamaica.  A total of 105 persons were recruited as they met the study's entry criteria (diagnosis of diabetes and 2 family members with early onset autosomal dominant type 2 diabetes (2)). Exclusion criteria were: ambulatory individual, current heart or kidney failure, blindness, a severe concurrent illness likely to limit life or require extensive systemic treatment, inadequate understanding or unwillingness to participate in the study.
    A total of 105 patients attending public and private clinics in the Kingston Metropolitan area of Jamaica were recruited. The study was a longitudinal/cross-sectional one and was conducted at the Department of Basic Medical Sciences, Mona which forms part of the University of the West Indies Faculty of Medical Sciences. The study received ethical approval from the University of the West Indies Faculty of Medical Sciences/ University Hospital of the West Indies Ethics Committee (IRB).
    At initial interview the study requirements were explained to the participant. A consulting physician ensured that the patient was well enough to participate in the study. After initial interviews 89 patients were selected for further participation in the study. Informed consent was obtained from each participant. Patients were asked from the first day of study to strictly adhere to all treatment plans recommended by their doctors and to keep all clinic appointments.  Demographic data were obtained by interviews. Adherence to treatment plan and attendance at clinics were self reported and monitored by reviewing of the docket by a consulting physician. Adherence to treatment plan was defined as poor if patient adhered to ≤ 49% of treatment recommendations, moderate if patient adhered to 50-79% of treatment recommendations and excellent if patients adhered to 80% or more of treatment recommendation. Poor attendance at clinic was defined as attending clinic less than 50% of recommended time, moderate 50% to 79% of recommended time and excellent 80% or more of recommended time. Glycemic control starting at baseline was monitored by checking HbA1c at 3 months intervals up to 12 months.  Body Mass Index (BMI) utilizing weight and height (weight/height – kg/m2 ) was measured by a standard stadiometer. Waist/hip circumference was done by measuring waist at the maximal circumference between the lower ribs and hip and measuring hip at the level of the maximal protrusion of the buttocks with a steel tape. Systolic and diastolic blood pressure measurements were obtained using a standard sphygmomanometer whilst the patient was seated. Hypertension was defined as a history of hypertension treatment or systolic pressure ≥ 140mmHg or diastolic pressure ≥ 90mmHg (9)
 

Results

    Eighty nine patients were assessed for glycemic control at 3 months intervals starting at baseline for a period of 12 months. According to demographic data from table 1: The patients involved in the study were of African descent. Mean age of participants at time of study was 42± 15.6 years. Mean age at time of diagnosis was 31.9 ± 5.9 years. The duration of diabetes in the cohort at the time of the study ranged from 0 to 57 years. Sixty point seven percent of the study cohort was taking oral agents only, and the other 39.3% were taking insulin.  Forty point four percent had known diabetes related complications (on diuretics for kidney problems/ lost some sensation in feet-neuropathy) and high blood pressure (systolic >130±6.5, diastolic > 90±4.8 mmHg). Total (5.4± 0.9mol/l) and LDL (3.4± 0.5 mmol/l)) cholesterol levels were elevated. BMI of these patients was 26.7±3.5kg/m2
    Thirty six persons or 40.4% of the study cohort had household income of < $(US) 5000.00 yearly.  Thirty six or 40.4% of the study cohort had < 5 years of formal education.  Approximately 60% of the study cohort moderately or poorly adhered to their treatment regimens whilst 73.1% had moderate or poor attendance at clinics.  Mean daily caloric intake of the study participants was 2500±45.0 k/cal.
Glycemic control :
General glycemic control (Table 1: All study participants)
  At 3 months mean HbA1c was 12.3±1.6%, at 6 months 12.0 ±1.0%, 9 months 11.7±0.9% and the end of 12 months 11.4±1.7%.  Mean fasting blood sugar was 11.1±2.8 mmmol/l at the beginning of the study.  At the end of 12 months fasting blood sugar was 8.9 ±0.9 mmol/l.
Sub-groups based on attendance patterns at clinics (Table 2)
  Patients with poor attendance at clinics had baseline HbA1c of 12.2±5.0, their
HbA1c decreased to 12.00 ± 3.9 at 3 months then remained at that level for 6 months, then decreased to 11.2 ±3.4 at 9 months and further decreased to 10.6±2.7 at 12 months.  There was no statistically significant difference in HbA1c between any of the periods. Patients with moderate attendance at clinics had HbA1c of 11.8±4.5 at baseline then a decrease to 11.0±4.2 at 3 months, an increase to 11.1±3.6 at 6 months, a decrease to 10.8±3.8 at 9 months then  a further reduction to 10.5±3.9 at 12 months. No statistically significant difference was noted between periods of assessment.  Patients with excellent attendance at clinics had a constant decrease in HbA1 over 12 months moving from 12.2±4.4 at baseline to 8.9±2.9. A statistically significant difference was noted between baseline and 12 months (p<0.05)
Sub-groups based on adherence to treatment plan (Table 3)
    Baseline and 3 months HbA1c were the same in patients with poor adherence to treatment plan. HbA1c then decreased steadily from 3 to 12 months. No statistical difference in HbA1c was noted between any three months period. Those patients with moderate adherence to treatment plan had an increase in HbA1c   from baseline to 6 months then a decrease below baseline value at 9 and 12 months. Patients with excellent adherence to treatment plan had a linear decrease in HbA1c
over 12 months moving from 11.3± 4.7 at baseline to 10.2± 4.0 at 3 months to 10.0 ± 2.7 at 6 months then to 9.4± 3.7 at 9 months and finally to 9.4 ±3.8 at 12 months.
Glycemic control in specific subgroups based on years of formal education (Figure 1)
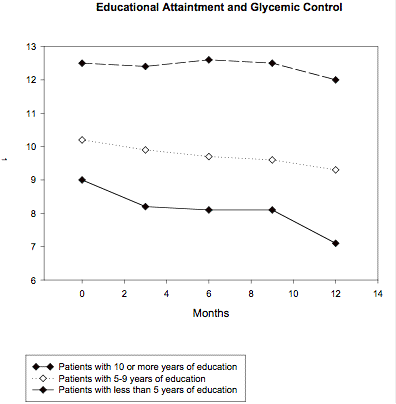


Figure 1. Measurements of Glycosylated Hemoglobin over 12 months
in early onset autosomal dominant type 2 diabetes patients with
different levels of education

HbA1c decreased significantly (9.0 ±1.0 % to 8.2 ± 0.8 %, p<0.05) during the first three months, then decreased non-significantly to 8.1 ±1.1% (p>0.05) by six months, remained steady at 8.1±1.1% between 6 and 9 months then decreased significantly  (from 8.1±1.1 to 7.7±1.0 %(p<0.05) between 9 and 12 months  in probands with 10 years of formal education.
    In probands with 5 to 9 years of formal education HbA1c decreased non-significantly from 10±2.1% to 9.9±1.8% (p>0.05) during the first three months, then decreased non-significantly from 9.9±1.8 to 9.7±1.8% (p>0.05) during three to six months then further decreased non-significantly from 9.7±1.8 to 9.6±1.7% from six to nine months then decreased significantly from 9.6±1.7 to 9.3±1.0% (P<0.05) from nine to twelve months.
     HbA1c decreased non-significantly from 12.5±1.1 to 12.4±2.4% (p>0.05) during the first three months, then increased non-significantly to 12.6±2.1% (p>0.05) by six months, decreased non-significantly from 12.6±2.1 to 12.5±1.9% (p>0.05) between 6 and 9 months then decreased significantly from 12.5±1.9% to 12.0 ±1.2% (p<0.05) between 9 and 12 months in probands with <5 years of formal education.
 
Glycemic control based on age (Figure 2)
     In persons  ≥ 50 years  HbA1c  non-significantly decreased from 12.2±3.1% at 0 month to 12.0±2.4 (p>0.05) at 3 months then rose significantly from 12.0±2.4% at 3 months to 12.9±3.9%  (p<0.05)at the end of 12 months. In persons < 50 years HbA1c decreased significantly from 11.4±1.0% at 0 months to 10.9±1.9% (p<0.05) at three months then further decreased significantly to 10.2±1.4% (p<0.05) by 12 months.
 Table 1:   Baseline- characteristics of the study cohort
                 (n=89)
---------------------------------------------------------------------------------------------------
-------------------------------------------------------------------------------------------------
Mean age at time of study (years)                      42± 15.6
Mean age at diagnosis (years)                            31.9 ± 5.9
Duration range of diabetes (years)                     0-57 years
On OHA                                                             54 (60.7%)                          
On Insulin                                                           35 (39.3%)
Known diabetes related complications              18 (20.2%)
High Blood Pressure (>130/90 mmHg)             18 (20.2%)
BMI (kg/m2 )                                                      26.7±3.5
Total Cholesterol (mmol/l)                                5.4±0.9
HDL (mmol/l)                                                   1.4±0.2
Triglyceride (mmol/l)                                        1.3±0.2
LDL (mmol/l)                                                    3.4±0.5
FBS  mmol/l                                                      11.1±0.8
Insulin mU/l                                                       16.2±4.9
Total kcal/day                                                     2500±45.0
Hospitalization profile
  Age ≥≥50 years                                                10 (11.2%)
   Age < 50 years                                                3(3.3%)
HbA1c (%)
0 month (beginning of study)                             12.3 ±1.2
3 months                                                             12.3± 1.6
6 months                                                             12.0 ±1.0
9 months                                                             11.7 ±0.9
12 months                                                           11.4±1.7
 Ethnicity
Afro-Jamaican                                                    89 (100%) 
Annual Household income ($US)
    <5000.00                                                        36 (40.4%)
      5-10000.00                                                   36(40.4%)
    $10,000.00                                                      17(19.1%)
Education level of Subjects
  < 5 years of formal education                           36(40.4%)                    
    5-9 years formal schooling                              36(40.4%)  
  10 years formal schooling                             17 (19.1%)
 Adherence to treatment regimen
   Excellent    (80-100% compliance)                 36(40.4%)
    Moderate (79-50% compliance)                     17(19.1%)
    Poor          (<50% compliance)                       36(40.4%)
  Scheduled attendance at clinics
    Excellent  (80-100% of time)                             24( 26.7%)                
    Moderate (79-50% of time)                               48 (53.3 %)
    Poor          (<50% of time)                                 17 (19.1%)
 
     Table 2: Attendance at Clinics and 12 months  Glycemic profile
Appointment keeping
 Time ( Months)
0
3
6
9
12
                       HbA1c
Poor
12.2± 5.0
12.0±3.9
12.0±2.9
11.2±3.4
10.6±2.7
Moderate
11.8±4.5
11.0±4.2
11. 0±3.6
10.8±3.8
10.5±3.9
Excellent
12.2±4.4
10.6±3.9
10.5±3.1
9.7±3.3
8.9±2.9


 Glycemic profile over 12 months of patients’ appointment keeping
   pattern
 
 
Table 3 : Adherence to Treatment Plan and HBA1c over 12 months
Adherence to Treatment Plan
  Time (months)
0
3
6
9
12
                         HbA1c
Poor
10.2±4.8
10.2±3.9
10.1±3.4
9.4±3.9
9.2±3.1
Moderate
10.2±4.7
10.4±4.7
10.8±4.1
9.5±2.9
9.3±3.6
Excellent
11.3±4.7
10.2±4.0
10.0±2.7
9.4±3.7
9.4±3.8


Patient’s adherence to their treatment plan and glycemic levels
from baseline to 12 months
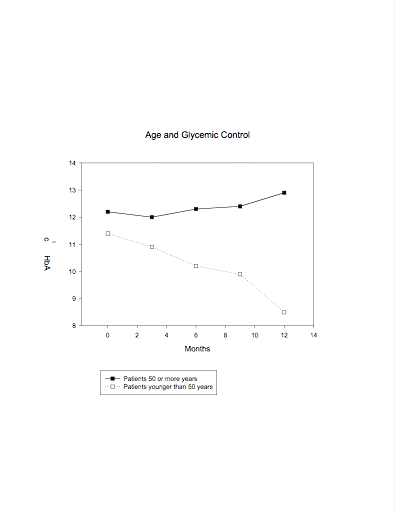
 

Figure 2: Measurements of Glycosylated Hemoglobin over 12 months
in early onset autosomal dominant type 2 diabetes patients based
on age
 

Discussion

 
In terms of demographic data of the entire cohort dyslipidemia (elevated total and LDL cholesterol), BMI above normal range, high blood pressure, long duration of disease and diabetes related complications were general features.  These features complicate and prevent tight control of glycemia . In the studied population (n=89) there was a less than 1% point drop in  HbA1c  at the end of twelve months. At the beginning of 12 months HbA1c was 12.3% and at the end of 12 months 11.4%.  When the cohort was divided into different subgroups, persons with ≥10 years of education had better glycemic control than persons with less education. Many studies have shown that, there are no correlation between educational level and glycemic control however Zgibor et al (10) has shown that specialist care was associated with a higher level of participation in diabetes self care practices and a lower HbA1c level. Care delivered by specialist has been associated with better glycemic control and delivery of practices measures that are more consistent with established practices guidelines (9,10).  Zgibor and collegeues(10) have also shown that patients receiving specialist care are more likely to have an educational level beyond high school and annual income >  (US) $20,000.00. The 20% of the cohort with ≥10 years of formal education had a greater than 1% drop in HbA1c level over a 12 months period, moving from 9.0% at baseline to 7.7% by the end of twelve months.
    Glycemic control is the only measure proven to prevent diabetic microvascular and neuropathic complications (5,6). Unfortunately, 40.0 % of the study cohort had higher HbA1c levels at the end of 12 months than at the beginning of the study.  The poor glycemic control may have been due to disease duration and poor self care. The disease duration of diabetes ranged from 0 to 57 years. Older people in the study tended to have the disease for longer periods. Of the cohort, the subgroup aged ≥ 50 years were the only group in which HbA1c was higher at the end of the study than at the beginning. HbA1c moved from 12.2% at baseline  to12.9% at the end of 12 months.  Blaum et al (11) found that disease duration and poor self-care were related to glycemic control. The patients ≥ 50 years had greater incidences of hospitalization (10 older persons versus 3 younger persons) due to diabetes related complications.  The Kumamoto study (2000) confirmed that improved glucose control reduces the microvascular complications such as retinopathy, nephropathy, and neuropathy in type 2 diabetes (6). The poor glycemic control in these patients may have precipitated microvasular complications and lead to the increase incidences of hospitalization.  In patients with type 2 diabetes prospective studies have shown an association between the degree of hyperglycaemia and increased risk of microvascular complications, sensory neuropathy, myocardial infarction stroke , macrovascular mortality, and all cause mortality(5-6,11)
    Regression analysis done in this study identified five variables associated with poor glycemic control : education, use of insulin, duration of diabetes, age and attendance at clinics. Persons ≥50 years based on demographic data  in this study tend to use insulin, had diabetes for a longer time, attended clinics less and were more likely to have <5 years of formal education. At the end of 12 months persons aged ≥ 50 years had poorer glycemic control with an increase in HbA1c
At 12 months.
   While the race/ethnic population was homogeneous, the socioeconomic status of the population was not. Most of the patients had very low income, a few patients however had ≥ 10 years of formal education and earned > $10,000.00 per year which limits the generalization of the study results.
    Finally, multiple factors affect glycemic control. The study did not incorporated disease severity, access/quality of care, self-care skills, exercise, psychological  status, behavioral pattern and knowledge of the disease which might have had effect on glycemic control (4-7,10,11-12)
     This study identified patients with early onset autosomal dominant type 2 diabetes that have poor glycemic control.  The study also identified patients with this form of atypical diabetes that might be able to have optimal control. The findings should not be generalized to all patients with early onset Type 2 diabetes but can be applied to racial/ethnically homogeneous populations.  In this study those who were older, had diabetes for a longer period of time, used insulin and had < 5 years of formal education had poorer glycemic control. The younger, better educated had better glycemic control and was closer to the optimal of < 7.0% (5,11). This study provides a useful methodology to assess disease management systems using longitudinal data. It does not provide answers to why patients are not optimally controlled but provides a beginning from which to investigate and address obstacles that might prevent patients with diabetes from having optimal glycemic control.

References

 
1  Rosenbloom A, Joe J, Young R, Winter W (1999). Emerging Epidemic
    of type diabetes in youth.  Diabetes care; 22(2):345-354
2 Doria A, Yang Y, Malecki M (1999).  Phenotypic characteristics of early-onset  
   autosomal-dominant type 2 diabetes unlinked to known maturity-onset
   diabetes on the young (MODY) genes.  Diabetes Care; 22:253–26.
3 WHO.  Diabetes Mellitus, Report of a WHO Study Group. Geneva,
      World Health Org (Tech. Rep. Ser., no.727), 1985
4 Nathan D( ).Initial Management of Glycemia in Type 2 Diabetes
  Mellitus. New Engl J Med.;  347:1342-1349
5Shichiri M, Ohkubo Y, Kishikawa H, Wake N (2000). Long-term results of the    
   Kumamoto study on optimal diabetes control in type 2 diabetic patients.
    Diabetes Care; 23 (2) : B21–B29
6 UK Prospective Diabetes Study (1998). Intensive blood-glucose control with
    sulphonylureas or insulin compared with conventional treatment and risk of
    complications in patients with type 2 diabetes (UKPDS 33). Lancet; 35
7 Devlin G, Timmis M, Balasubramaniam W, O'Neill W (2004).
   Optimal
glycemic control is associated with a lower rate of target vessel  
   revascularization in treated type II diabetic patients undergoing elective
   percutaneous coronary intervention. Journal American College Cardiology;
   43(1): 8 - 14.
8  Rhee MK, Slocum W, Ziemer DC,Culler SD,Cook CB, El-Kebbi IM,Gallina
   DL,Barnes C, Phillips LS (2005). Patient adherence improves glycemic control.
  Diabetes Educator ;31(2):240-50
9 Carretero OA, Oparil S (2000).Essential Hypertension : Definition and
    Etiology.Circulation;101:329
10 Zgibor JC, Songer TJ, Kelsey SF, Weissfeld J, Drash AL, Becker D, Orchard
    TJ (2000). The association of diabetes specialist care with health care practices
    and glycemic control in patients with type 1 diabetes: a cross sectional analysis
     from the Pittsburgh Epidemiology of Diabetes Complications Study. Diabetes
    Care 23:472–47
11 Blaum CS, Velez L, Hiss RG, Halter JB. Characteristics related to poor  glycemic control in NIDDM  patients in community practice. Diabetes Care. 1997;20:7–11.
12 Anderson RJ, Clouse RE, Freedland KE, Lustman PJ (2001).  The  prevalence
     of co-morbid depression in adults with diabetes: a meta-analysis. Diabetes
     Care; 24:1069–1078.
Corresponding author:   Rachael Irving, Department of Basic Medical Sciences, University of the West Indies, Mona, Kingston, Jamaica.
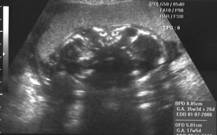
Monocephalus Diprosopus (Complete Craniofacial Duplication) Associated with Hydrancephaly and Other Congenital Anomalies.


Dhaliwal, Adinkra, Ennis, Green
 

History and Presentation

A 22 year old in her third pregnancy, booked in the antenatal clinic at 10 weeks gestation. She had a base line scan which confirmed the gestational age at 10 weeks and four days. The heartbeat was visualised with normal appearances.
Her previous pregnancies were complicated by anaemia. Labour was induced for both the pregnancies due to post-maturity. There was no complications- intrapartum or postpartum. Birth weights were 4,018 and 3,656grams respectively, with no abnormalities detected.
Routine serum maternal infection screening in the current pregnancy for: Syphilis, Rubella, Hepatitis B surface antigen and Human Immunodeficiency virus were unremarkable. The patient declined serum screening for Downs’s syndrome and Spina bifida.
hydranecephaly
Fig 1- Hydranencephaly.
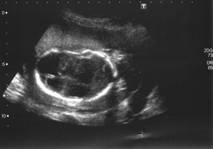
She then attended a routine anatomy scan at 20 weeks gestation and was found to have the following – oligohydramnios, abnormal appearances of the kidneys, spine and head. The lateral ventricles of the brain were dilated and the head was lemon shaped. The cerebellum was not seen. Both the kidneys were grossly enlarged and multi cystic. There appeared to be a spinal abnormality. The patient was then referred to a fetomaternal specialist for a second opinion. The findings were of conjoined heads with two sets of eyes and both brains were hydrancephalic with absence of cerebellar tissue (Fig1 &2). Left diaphragmatic hernia, short barrel-shaped chest, bilateral multicystic kidneys (Fig3), rocker- bottom type feet, abdominal distension and abnormal spinal structure.
 conjoined heads Fig.2 Conjoined Heads
 multicystic dysplasia of kidneys. Fig 3-Multicystic dysplasia of the kidneys and Kyphosis and scoliosis of thoracic and lumbar spine.
 The parents were counselled that the multiple foetal anomalies was likely to represent a syndrome or an aneuploidy. The risk of obstructed labour was also explained due to enlarged head and abdominal circumference. The couple opted initially for further invasive assessment. Foetal blood sampling was performed and was sent for cytogenetical analysis. The received sample was inconclusive as it was of maternal origin. Due to the complex abnormality, the couple were further counselled about Termination of the pregnancy and obtaining a full post mortem examination in order to elucidate the full extent of the anomaly.
Fetocide  was carried out at 21 weeks with potassium chloride (KCL) intracardiac injection.  Once, fetal cardiac arrest was confirmed, the intracerebral fluid was removed in order to decompress the head(s). Medical management for termination was then commenced.
Findings at post mortem:
X-Ray and MRI confirmed two fetal faces and skull bases. Single cervical spine with multiple thoracic vertebral segmentation anomalies with no other major skeletal abnormality. Bone age was consistent with 21 fetal weeks.
General external and internal examination concluded: A male conjoined symmetrical twin of “Y” type (Terata catydidymus) with a single lower body, two faces, one head (Disprosopus) and normal upper and lower extremities (Fig 4).
 Fig4two fetal faces
There was a left sided diaphragmatic hernia, secondary lung hypoplasia, congenital heart disease (VSD, overriding aorta and hypo plastic ascending, descending aorta and aortic arch), bilateral dysplastic cystic kidneys, hypoplasia of urerters and urinary bladder, spina bifida aperta of thoracic and lumbar segments and two, non fused brains, each with two hemispheres of various size (two pairs of olfactory and optic nerves and two hypophyses), absent cerebellum and a hypoplastic midbrain. Beneath the scalp were two entirely separate frontal bones and two partly fused parietal bones that were facing the anterior aspect of the head. The posterior aspect of the head consisted of two parietal and a partly fused single bi-lobed occipital bone.   The trunk was extremely short and broadened with a shortened barrel-shaped chest. There were two pairs of eyes, two separate noses and mouths. The mandibulae were separate but hypotrophic and under-developed. There were two separate tongues that were fused to their roots creating one broader pharynx with a normal-looking epiglottis, larynx, and single trachea showing a normal bifurcation for the two main bronchi. There was a single heart with a normally positioned liver, spleen and pancreas. The gastrointestinal tract and mesentery were also normally rotated.  Cytogenesis on cord and placental tissue samples did not detect any chromosomal abnormality. A normal male karyotype was recorded. On further genetic studies there was no evidence of isochromosome 12p, which is associated with diaphragmatic hernia. There was also no histological evidence of cerebellar tissue.

Discussion

Conjoined twin’s results from an embryological disturbance in the separation of twins during the 2nd week of pregnancy (12-13 days) as a result of abnormal splitting of the post – implantation blastocyte. Such incomplete separated germinal discs lead to this extremely rare fetal anomaly. The reported incidence is 1:50,000 to 1:200,000 births and 1% of monochorionic twins.
They are classified in three groups: 1) Terata Catydidymus – Diprosopus, Dicephalus, Ischiopagus (6-20%) and pyopagus (10-20%). 2) Terata Anadidyma – Dipygus, Syncephalus and Crainopagus (6-12%). 3) Terata Anacatadidyma – Thoracopagus (30-40%), Omphalopagus (25-30%) and Rachipagus. The majority of conjoined twins are thoracopagus and omphalopagus – approximately 75%. Monocephalic diprosopus conjoined twins are rare form characterized by a single body, one unusual head, two faces or a spectrum of duplication of craniofacial structures. Diprosopus results in an error related to the neurulation of the embryo (Moore KL. 1988).  Complete craniofacial duplication, as in this case, may be due to the forking or bifurcation of the notochord rostrally, with the formation of two side-by-side vertebral axes, neural plates and their neural crest derivatives (Machin G, 1993).
In most of the reported cases the foetuses were anencephalic, where duplication of the brain was impossible (Gorin et al., 1990). In this particular case, there were two separate brains each showing two hemispheres, two pairs of olfactory and optic nerves, two hypophyses and one midbrain with no detectable cerebellum.
 There is a high incidence of malformations that are unrelated to the point of conjunction. These include: Neural tube defects, diaphragmatic hernia, cleft lip and palate (Chervenak et al., 1985) and imperforate anus. Other associated anomalies are: Anencephaly, spina bifida, encephalocele, holoprosencephaly, hydrocephaly, abnormalities of the cranial nerves (Barr M. 1982), tetralogy of Fallot, membranous ventricular septal defect, atrial septal defects, artioventricular canal malformation and dextrocardia, double outlet right ventricle and patent foramen ovale (Turpin et al., 1981).  The female: male ratio is 2:1 in up to 90-95% of the reported cases. A normal chromosomal analysis has been reported by various authors (Moerman et al., 1983; Sharony et al., 1993; Rai et al., 1998 and Wu et al., 2002). In this case, molecular cytogenesis did not detect any chromosomal abnormality.
In conclusion, we present a case report of a foetus with complete facial duplication that had intact calvaria with multiple anomalies.

References

1) Barr M. 1982. Facial duplication: case, review, and embryogenesis. Teratology 25:153-159
2) Chervenak, F.A., Pinto, M. M., Heller, C.I., Norooz, H. (1985). Obstetric significance of foetal crainofacial duplication. A case report, J. Reprod. Med., 30, 74-76.
3) Gorlin, RJ, Cohen, MM Jr, Levin, LS, editors. 1990. Syndromes of the head and neck, 3rd ed. New York: Oxford University Press.
4) Machin, G. 1993. Conjoined twins: implications for blastogenesis. Birth Defects Orig Artic Serv 29: 141-179.
5) Moerman, PH., Fryns, JP. Goddeeris P, et al 1983. Aberrant twinning (Diprosopus) associated with anencephaly. Clin Genetics 24:252-256.
6) Moore, KL 1988. The developing human: clinically oriented embryology, 4th ed. Philadelphia: W.B. Saunders Company.p.53-59.
7) Sharony R, et al. 1993. Diprosopus: A pregastrulation defect involving the head, neural tube, heart and diaphragm. Birth defects Orig Serv 29:201-209.
8) Rai VS, et al. 1998. Antenatal diagnosis of complete facial duplication: A case report of a rare craniofacial defect. Prenatal Diagnosis 18:618-620.
9) Turpin, IM, Furnas, DW, Amlie, RN. 1981. Craniofacial duplication (Diprosopus). Plast Reconstruct Surgery 67:139-142.
10) Wu, J., Staffenberg, DA. Mulliken, JB.,  and Shansken, AL. Diprosopus: A unique case and review  of the Literature. Teratology 66:282-287 (2002).
About the authors:
Harjit Dhaliwal, M.B.B.S, D.F.F.P, Paul Adinkra M.B.B.S, Diane Ennis, RGN, RM, PGC, Pauline Green MRCOG.Drs Dhaliwal and Adinkra are Specialist Registrars, Diane Ennis is a midwife sonographer and Pauline Green is a Consultant Fetomaternal specialist all based at Arrowe Park Hospital , Wirral, United Kingdom.

The Decline of NHS Inpatient Psychiatry in England


Professor Ben Green, Consultant Psychiatrist Cheadle Royal Hospital, Visiting Professor of Psychiatry, University of Chester  and Honorary Senior Lecturer University of Liverpool, FRCPsych FHEA MB ChB

Abstract

Background
Historically the NHS has reduced mental health bed numbers since the 1950s. This paper looks at whether NHS psychiatry bed numbers have further declined in the last decade and how this has affected admissions in England for various ICD-10 diagnoses in recent years.
Aims
To examine the fall in NHS bed numbers for mental health in the last decade and the effect on annual admissions and bed days for various ICD-10 diagnoses from 2002-2007.
Method
Government statistics for NHS bed numbers and admissions by diagnosis were commissioned from a Department of Health agency and obtained from the HSEOnline website. The analysis focused on the 15-59 age range. These were statistically analysed by logistic regression methods using the SAS statistical package. Bed figures for the Independent sector were compared descriptively.
Results
In the last ten years there has been a highly significant fall in the number of NHS mental health beds. This is associated with a highly significant reduction in the annual admissions for schizophrenia, depression, bipolar disorder, depression, and stress and anxiety related disorders in England. There has been no fall in admissions for eating disorders. There has been a significant increase in NHS admissions for alcohol related disorders. There has been an increase in the numbers of NHS psychiatric patients admitted to independent sector psychiatric beds.
Conclusions
There has been a highly significant recent decline in the number of NHS provided mental health beds and a corresponding fall in psychiatric admissions for a variety of diagnoses.

Declaration of Interest
BG is a consultant psychiatrist works at Cheadle Royal Hospital, an Independent sector hospital


Introduction


Historically the NHS has always contained many thousands of inpatient psychiatric beds.
At its inception in 1948 over half the inpatient beds in the NHS belonged to psychiatry. The rise in public psychiatry beds occurred well before the NHS however as Figure 1 shows. This represents a substantial county asylum building program. Shortly after the inception of the NHS there was a peak provision in 1955 of some 150,000 mental health beds. In conjunction with the development of effective antipsychotic medication the number of NHS mental illness beds began to fall.
 Mental Health Beds 1850-2007
 
Figure One: Public Mental health Bed Numbers 1850-2007 (NB Population in 1850- 17 million, Population in 2007 61 million). The peak is in 1955.

In Sir David Goldberg’s recent paper in the BJPsych he noted an incremental reduction in mental health beds in recent years (mainly in acute mental health) along with an increased investment in community teams1.

This paper considers whether the decline has continued in recent years and seeks to analyse overall bed numbers, admission rates for various psychiatric ICD-10 diagnoses, bed days for various conditions and also considers what figures are available for the Independent sector, which has grown during this same period.

Method

NHS bed figures are published annually by the Department of Health and can be accessed online. These are available by speciality and were obtained for each year for mental health from 1997-20072. 
Databases of NHS admission figures are available online for episodes of illness though Health Episode Statistics (HESONLINE) from 2002-20063. These databases can be interrogated for admissions for various physical conditions according to ICD-10 categories. Data area further available for bed days attributed to various conditions and can be further analysed by sex and age groups (0-14, 15-59, 60-74, 75+ and unknown). The data can further be analysed by provider Trust or ‘NHS organisation’. This paper considers data for several main ICD-10 diagnostic groups across England, by sex, across all ages, and specifically in the main provided  ‘adult’ group of 15-56). The paper focuses on Schizophrenia (F20 - all types combined), Bipolar Affective Disorder (F31 - all types combined), Depression (both Depressive Disorder F32 and Recurrent Depressive Disorder F33), Eating Disorders (F50- all types combined), Alcohol Disorders (Mental and behavioural disorders due to use of alcohol F10 - all types combined) and as a possible indicator of anxiety or neurotic disorders the ICD-10 category F43 (Reaction to stress and adjustment disorders – all types combined). Outpatient data for 2003-2007 are also available online, but were outside the scope of this paper.
Data for 2007 were obtained through commissioning a separate analysis from the HES team at the Department of Health specifically for this paper - ahead of routine annual publication in December.
The numbers of NHS beds, admission numbers and bed days for various years and diagnoses were compared across years using a log-linear model for non-ordered categorical variables by the method of maximum likelihood4 using the Statistical Analysis System (SAS)5 .
Finally a literature search of MEDLINE, PSYCInfo, CINAHL, the Cochrane Library, Biomed , PsycARTICLES, Intute, Scopus and Science Direct databases was conducted to detect recent relevant papers on NHS mental health bed numbers. The HANSARD database was also consulted for any recent parliamentary questions and answers on mental health bed numbers.

Results

Data from the Department of Health bed availability data and UK Parliamentary Written Answers yield figures demonstrating an inexorable decline in NHS mental health beds in England in the last decade, (Figure 2) 2,6.

NHS Mental Illness Beds Decline
Figure 2: NHS English Mental illness beds 1997-2007

In early 2007 there were about 28,800 mental health beds in all specialities including acute, rehabilitation, old age, child and so on. Later the same year however the figure had fallen to about to 27,914 beds and the NHS provision is currently declining by about 1,000 beds per year. At some point this may plateau, but there is no sign of this as of yet. If the rate of decline continues trend forecasting would project a figure of 26121 beds in 2010 and 17205 beds in 2020.

The continuing fall in NHS mental health beds from 1997 onwards (Figure 4) was analysed statistically using logistic regression. The decline in all years was statistically significant (p<.0001) and compared relative to 2007 figures the odd ratios of having a mental health bed in each previous year varied from 1.06 for 2006  to 1.36 for 1997.
Government occupancy figures for various PCT’s across the country indicate for mental health beds that the occupancy rate is about 90%, but independent surveys have topped 120% in some inner city areas7.

Schizophrenia

Male and female admissions for all F20 diagnoses of schizophrenia (including paranoid, hebephrenic, catatonic, residual etc.) were considered for the years from 2002-2007 and the number of admissions across all ages, admissions for the age range 15-59 and total bed days across the year obtained (Table One).

Admissions
2002-2003
2003-2004
2004-2005
2005-2006
2006-2007
Male Total
14391
13968
14677
13558
9835
Female Total
7262
7169
7434
6776
4913
15-59 Male
13321
12886
13549
12413
8950
15-59 Female
5655
5562
5755
5228
3835
Bed days Male
1165034
1202816
1422572
1285701
850943
Bed days Female
1729972
1788078
2068333
1870301
335752

Table One: Admissions for Schizophrenia (F20) in the NHS for England 2002-2007

The figures for the approximately adult working age range (15-59) are presented graphically in figure five. These show a gradual fall in the number of admissions. Most admissions are for males with a marked fall in bed days for males and a 75% decrease in bed days for females in 2006-2007.
Schizophrenia admissions (F20) for 2002-2007 (Table 1) were analysed using logistic regression and declined in a statistically significant way (p<.0001) , with odds ratios for admission in 2005/2006 relative to 2006/2007 being 1.39 and 2002/2003 relative to 2006/2007 being 1.49. That is to say relative t 2006/2007 all previous years patients with schizophrenia had a higher likelihood of being admitted. There was no significant difference in the decline for males and females. Bed days for schizophrenia also decrease significantly as the years went by (p<0.0001, with odds ratios for past years relative to 2006/2007 varying between 1.37 and 1.52). There is a significant difference in the decline in bed days for males and females (p<0.0001 with  odds ratios varying between 3.68 and 3.76). A Wald chi-square text on the effect of the overall bed number reduction on admission figures for schizophrenia showed a significant effect (Wald chi-square 13.0658, df=4, prob =0.01).

Figure Three: English NHS Admissions for Schizophrenia amongst 15-59 year olds 2002-2007


Figure Four: NHS Bed Days for Schizophrenia 2002-2007

Affective Disorders

Male and female admissions for all F31 diagnoses of bipolar affective disorder were considered for the years from 2002-2007 and the number of admissions across all ages, admissions for the age range 15-59 and total bed days across the year obtained (Table Two). The usual length of stay was between 50 and 60 days. The data for bipolar affective admissions for the 15-59 age range are presented graphically in Figure Seven.


Admissions
2002-2003
2003-2004
2004-2005
2005-2006
2006-2007
Male Total
4998
4618
4929
4510
3780
Female Total
8046
8491
7588
7085
5672
15-59 Male
4027
3771
3944
3577
2952
15-59 Female
5851
6182
5430
5012
3984
Bed days Male
257869
249711
279299
259814
159022
Bed days Female
416575
437177
429272
396104
208547

Table Two: Admissions for Bipolar Affective Disorder (F31) in the NHS for England 2002-2007

Admissions for bipolar disorder (F31) for 2002-2007  were analysed using logistic regression and declined in a statistically significant way (p<.0001) , with odds ratios for being admitted in 2005/2006 relative to 2006/2007 being 1.21 and 2002/2003 being 1.36.

There was no consistently significant difference in the decline in admission numbers for males and females.

Bed days for bipolar disorder also decrease significantly as the years go by (p<0.0001 with odds ratios varying between 1.57 and 1.75) and there is a significant difference in the decline for males and females (p<0.0001 with  odds ratios varying between 1.16 and 1.33). The number of available beds did not have a statistically significant effect on admissions for bipolar disorder.


Figure Five: NHS Admissions for Bipolar Affective Disorder 2002-2007

Male and female admissions for both F32 and F33 diagnoses of depressive disorder (F32 being depressive episodes of varying severity and F33 being recurrent depressive disorder) were considered for the years from 2002-2007 and the number of admissions across all ages, admissions for the age range 15-59 and total bed days across the year obtained (Tables Three and Four). The usual length of stay for depressive episodes was between 30 and 40 days, and this shows no particular trend downwards. The data for depressed admissions for the 15-59 age range are presented graphically in Figures Six and Seven.

Admissions for depressive episodes for 2002-2007 were analysed using logistic regression and these declined in a statistically significant way (p<0.0001) , with odds ratios of being admitted for 2005/2006 (relative to 2006/2007) being 1.17 and 2002/2003 being 1.29.

There were significant differences in the decline in admission numbers for males and females in most years, but not all (2005-2006 being an exception).
Bed days for depressive episodes also decrease significantly as the years go by (p<0.0001with odds ratios varying between 1.1 and 1.36) and there is a significant difference in the decline for males and females (p<0.0001 with  odds ratios varying between 1.04 and 1.08).
A Wald chi-square text on the effect of the overall bed number reduction on admission figures for depressive episodes  showed a significant effect (Wald chi-square 1184.89, df=4, prob =0.0001).

Admissions
2002-2003
2003-2004
2004-2005
2005-2006
2006-2007
Male Total
9280
8958
8695
8190
6648
Female Total
14489
13365
12533
11330
10922
15-59 Male
6257
6174
5960
5672
4817
15-59 Female
8650
8082
7861
6787
5611
Bed days Male
309036
292939
290992
250033
226640
Bed days Female
551200
518342
499458
439465
372348

Table Three: Admissions for F32 depressive episodes in the NHS for England 2002-2007

Admissions
2002-2003
2003-2004
2004-2005
2005-2006
2006-2007
Male Total
2418
2195
2240
1924
1581
Female Total
5576
4957
4817
4294
3310
15-59 Male
1494
1350
1217
1041
869
15-59 Female
3205
2709
2606
2219
1660
Bed days Male
52224
44789
45276
39853
30831
Bed days Female
263800
103578
103011
80168
57852

Table Four: Admissions for F33 (Recurrent depression) in the NHS for England 2002-2007
Admissions for Recurrent Depression (F33) for 2002-2007  were analysed using logistic regression and declined in a statistically significant way (p<.0001) , with odds ratios for 2005 being 1.19 and 2002 being 1.71.
There were no significant differences in the decline in admission numbers for males and females.
Bed days for depressive episodes also decrease significantly as the years go by (p<0.0001with odds ratios varying between 1.29 and 1.69) and there is a significant difference in the decline for males and females (p<0.0001 with odds ratios varying between 1.07 and 2.69).

Figure Six: NHS Admissions for F32 Depressive Episodes 2002-2007
 
Figure Seven: NHS Admissions for F33 Recurrent Depressive Disorder 2002-2007

Most NHS admissions for affective disorder are for females [comment on epidemiology here]. In both F32 and F33 diagnostic categories there has been a consistent and marked decline in the number of admissions for both males and females between 2002-2007.

In 2002-2003 there were in total some 31,763 adult admissions for depressive disorders F32 and F33, but the number of admissions fell to a total of 22,461 in 2006-2007. This represents a fall of 9,002 admissions across England and in percentage terms this is a 28% reduction in five years.

Eating Disorders
Figures for admissions are presented in Table Four and presented graphically for the 15-59 age group in Figure Eight.

Admissions
2002-2003
2003-2004
2004-2005
2005-2006
2006-2007
Male Total
136
122
154
200
193
Female Total
1397
1373
1497
1682
1452
15-59 Male
81
70
89
128
109
15-59 Female
1113
1102
1214
1365
1190
Bed days Male
5317
5689
4909
7479
4112
Bed days Female
71588
74503
81719
82261
58414
Table Five: Admissions for F50 Eating Disorders in the NHS for England 2002-2007
Figure Eight: NHS Admissions for F50 Eating Disorders (15-59) 2002-2007

Admissions for Eating Disorders (F50) were analysed using logistic regression. There was no statistically significant change in overall admissions, but a significant change was found in bed days (p<0.0001 with odd ratios varying  from 1.29 in 2002-2003 to 1.82 in 2005-2006). A Wald chi-square text on the effect of the overall bed number reduction on admission figures for eating disorder showed no significant effect.

Stress and Anxiety Related Disorders (F43)

The data for anxiety disorders reveals that despite a pressure on overall bed numbers there are still admissions with primary diagnosis of anxiety disorder (Table Six). The overall trend though is downward (Figure Nine).

Admissions
2002-2003
2003-2004
2004-2005
2005-2006
2006-2007
Male Total
2964
2714
2662
2152
1904
Female Total
2979
2759
2525
2180
1849
15-59 Male
2734
2471
2384
1867
1671
15-59 Female
2653
2429
2194
1860
1562
Bed days Male
40793
45991
45331
39108
28340
Bed days Female
50040
54316
52575
45255
26548

Table Six: Admissions for F43 Stress and Anxiety Related Disorders in the NHS for England 2002-2007

Figure Nine: NHS Admissions for F43 Stress and Anxiety Related Disorders (15-59) 2002-2007

Admissions for Anxiety Related Disorders for 2002-2007  were analysed using logistic regression and declined in a statistically significant way (p= less than or equal to .001), with odds ratios for 2005/2006 being 1.12 and 2002/2003 being 1.63.

There were no significant differences in the decline in admission numbers for males and females.
Bed days for anxiety also decrease significantly as the years go by (p<0.0001with odds ratios varying between 1.38 and 1.62) and there is a significant difference in the decline for males and females (p<0.0001 with odds ratios varying between 1.23 and 1.30).

A Wald chi-square text on the effect of the overall bed number reduction on admission figures for stress and anxiety related disorders showed a significant effect (Wald chi-square 147.13, df=4, prob =0.0001).

Alcohol related disorders (F10)
The F10 category is a broad one encompassing acute intoxication, delirium tremens and dependence. All of these present quite differently and require differing inpatient service responses. It is unlikely that all these admissions were to adult mental health inpatient beds, but that a fair proportion were instead to accident and emergency and medical beds. The main point is to observe the very rapid recent acceleration of admissions to the NHS related to alcohol. This increasing trend is most likely to continue.

Admissions
2002-2003
2003-2004
2004-2005
2005-2006
2006-2007
Male Total
19528
21794
24769
27116
27841
Female Total
10335
10204
11577
12747
12212
15-59 Male
16389
18119
20871
22759
23527
15-59 Female
5851
7777
9084
10123
9762
Bed days Male
158026
161181
169031
149194
135847
Bed days Female
71088
73035
74215
71806
57203

Table Seven: Admissions for F10 Alcohol Related Admissions in the NHS for England 2002-2007
 

Figure Ten: Admissions for F10- alcohol related disorders
Admissions for Alcohol Related Disorders for 2002-2007  were analysed using logistic regression and increased in a statistically significant way (p= less than or equal to 0.001), with odds ratios for 2005/2006 relative to being admitted with an alcohol related disorder in 2006/2007 being 0.96 and 2002/2003 being 0.69.

Bed days for anxiety also change significantly as the years go by (p<0.0001with odds ratios varying between 1.09 and 1.24) and there is a significant difference in the change for males and females (p<0.0001 with odds ratios varying between 1.06 and 1.14).
Independent Sector
The turnover of independent mental health hospitals in 2006 was estimated by Laing & Buisson at £845 million, compared to the NHS in-house supply cost of inpatient, outpatient and community services of £9.5 billion for the UK8. The independent sector’s share of the mental healthcare sector is thus about 8%. The majority (85%) of independent mental health hospital beds are funded by the NHS.  The data for the Independent sector are not collated in a directly comparable way to the NHS HSE data. Over 50% of independent sector beds are probably for patients detained under the Mental Health Act.  Medium secure beds accounts for 24% of the total capacity and acute psychiatry for about 20%. Brain injury rehabilitation accounts for 7% of bed provision. Over fifty percent of the Independent Sector beds are provided by four groups: Partnerships in care, Priory Healthcare, St Andrews Group and Care Principles. Table Eight shows that bed numbers are steadily increasing. Independent Sector mental health hospital revenues have been growing at between 16% and 20% annually in recent years.


Numbers of Hospitals/Units
Numbers of Beds
2003
168
6212
2004
175
6370
2005
213
6942
2006
227
7616
2007
229
8030

Table Eight: Numbers of Independent Sector Mental Health Units and Beds 2003-2007 (Laing & Buisson)
Figure 11: Independent Sector Psychiatric Beds 2003-2007 (Laing & Buisson)
 
Figure 12: Independent Sector Psychiatric Units / Hospitals 2003-2007 (Laing & Buisson)

In 1998 Laing & Buisson estimated that 9% of all acute psychiatric beds were provided by the independent sector with a third of these being NHS funded 9.

Outpatient Activity

HESOnline data also includes some statistics regarding NHS outpatient activity in England3. The activity shows an increase in recent years, but the meaning of the increase is unclear as the nature of the contacts and with whom depends on interpretation of the definitions concerned. For instance ‘first attendance’ appointments for F20 Paranoid Schizophrenia rose from 304 in 2003/2004 to 2493 in 2006/2007. ‘All attendances’ for appointments for F20 Paranoid Schizophrenia rose from 2713 in 2003/2004 to 14665 in 2006/2007.

Discussion


Doctor Pangloss was a character in Voltaire’s satire Candide who espoused a particularly flawed, but admirably optimistic philosophy. Essentially Panglossian philosophy was that all was for the best. Typical Panglossian logic is exemplified by this quote:

‘It is demonstrable, ‘ said he, ‘that things cannot be otherwise than as they are; for as all things have been created for the best end. Observe for instance, the nose is formed for spectacles, therefore we wear spectacles’.

The received political wisdom is that the massive investment in home treatment teams for ‘severe and enduring mental illness’ including assertive outreach, early intervention and crisis intervention teams has allowed a reduction in hospital admissions and thereby prompting mental health beds to be further reduced.

This political stance has been echoed by research papers noting the coincidence of increasing community team expenditure (e.g. on crisis resolution teams) and the fall in inpatient admissions and assuming a causal relationship 10, 11. This in itself may be an example of Panglossian reasoning. Glover et al‘s 2006 paper for instance fails to take account of a simultaneous and dramatic fall in capacity on admission rates or an increase in use of independent sector beds11. A fall in capacity and permanently high occupancy levels (sometimes reportedly above 100%) of those beds form a distinct barrier to inpatient admissions. Added to this are the increasingly unpleasant nature of remaining inpatient beds and the increasing use of Mental Health Act compulsion to admit people to these beds 12. Acute admission wards in 2006 were characterised as being poorly designed, poorly maintained and with a lack of therapeutic and leisure activities leading to boredom, aggression and violence, with a resulting concentration of a more challenging group of patients 13.
Over the last decade the Mental Health Act Commission has regularly been reporting occupancy rates of over 100% on some 40% or so of adult acute wards visited by the Commission. Inpatient beds are thus less refuge or ‘asylum’ than themselves a source of stress and less than intrinsically therapeutic. According to a 2008 Health Care Commission survey of all 69 trusts providing acute mental healthcare – involving some 554 wards. 23% of wards were deemed ‘weak’ on a range of factors with nearly 20% were deemed weak for safety 14.
Perhaps these negative features of acute wards and their diminishing numbers of beds are more linked to a fall in admissions for depression than any potential benefits of home treatment. For the in-patient beds that remain the ward atmosphere may no longer be therapeutic or conducive to recovery for depressed patients. Incidents on such wards have the capacity to be damaging to staff as well 15. Bowers and Nijman have estimated the risk of physical injury to inpatient nursing staff to occur to 1 in 10 nurses per year 16.

The reduction in beds and organisation of community teams is largely based on philosophical ideas 17. The physical alteration to services of bed closures is thus conducted on a philosophically weighted and relatively evidence-light basis. This could be characterised as a brave, uncontrolled experiment, but one conducted without the involvement of a research ethics committee, and the absence of any patient consent. The overall intentions may be laudable, and the eventual outcome could be good, but there is seemingly no will to co-ordinate measurement of the effects of the experiment before and after the intervention. The reduction in beds is, for now, seemingly irreversible and for the next decade at least the mentally ill patents of the NHS must make do mainly with community care. Even so, the jury on community care is still out. Evaluative papers on community care even now stress their preliminary nature 18, but the policy has already been implemented in the UK.
The most recent Cochrane review of crisis intervention for severe mental illness concluded that there were few studies that met their inclusion criteria and that although home treatment and crisis intervention were possible management strategies some 45% of patients eventually required admission 19. Crisis intervention is unsuited to un-cooperative patients and patients at risk of self neglect 20. The Cochrane team concluded to that ‘If this approach is to be widely implemented it would seem that more evaluative studies are still needed’ 19.

The most recent Cochrane review of early intervention for psychosis also found it difficult to locate sufficient high quality studies 21. They included seven studies, but noted that all these all adopted different interventions and as they were unable to identify sufficient trials they were unable to draw any definitive conclusions and proposed a ‘concerted international programme of research to address key unanswered questions’. If we conceptualise, just for a moment, ‘crisis resolution’ and ‘early intervention’ to be drug treatments for an individual patient the Cochrane reviews hardly seem to be ringing endorsements as the basis for prescription. Nevertheless these newer modes of management have been rolled out across the country and previous methods of management swiftly jettisoned. The previous status quo of standard inpatient/outpatient psychiatry had its problems undoubtedly, but now, after the event, can we really justify or rationalise the physical change in our services on the basis of solid evidence? In the longer term the proponents of community care and the destruction of inpatient psychiatry could be judged correct, but the decisions to visit changes on services were not made on adequate biomedical evidence.
Government Ministers have used suicide rates to suggest that mental health policies are effective in inpatient and community settings. In 2008 the Care Services minister described a reduction in total numbers of suicides among mental health in-patients as ‘encouraging’, but failed to factor in a declining number of inpatient beds. A comparison of the ratio of suicides to mental health beds makes a less impressive statistic. In 1998 there were some 187 inpatient suicides 22  in the context of 38,000 beds and in 2005 the Minister was noting 157 suicides in 2004 in the context of 32252 beds. The ratio is comparable.
Hospitalisation has often been vaunted as an outcome measure for various interventions23 . The fall in inpatient capacity and associated barriers to admission would indicate that hospitalisation rates should not necessarily be seen as reliable outcome measures unless this decline in beds is controlled for.

Discussion on particular diagnostic categories
The data show a decline in admissions and bed days for schizophrenia with a steeper decline for females with schizophrenia. The decline is statistically linked to a pre-existing and continuing fall in overall mental health bed numbers. Although there has been a significant fall in admissions for bipolar disorder, this decline is less affected by the overall decline. This may reflect the dramatic nature of presentations with bipolar disorder and a relatively higher pressure to admit to a diminishing supply of NHS beds than with other diagnoses.

Admissions for depression and stress and anxiety related disorders also declined significantly with significantly more reduction in female admissions. This could reflect a more troubling or threatening ward environment in mixed acute wards, which makes them less conducive to female admissions. It would be interesting to analyse the above figures for various diagnoses with annual data on the proportion of admissions for males and females under the Mental Health Act to see whether there may be pressure against voluntary admissions, particularly for females.
There was a highly significant association between overall mental health bed reductions and declining depressive episode admissions, perhaps suggesting particular barriers to admission for patients with depression. There is an urgent need to study this area further as previously depression and anxiety were the most common reasons (29.6%) for admission in 1999/2000 24. Particularly needed are studies that measure the levels of distress in patients with depression in community settings, whether they are in contact with services, whether they are receiving evidence based treatments from adequately trained practitioners, suicide rates in this particular diagnostic grouping and the associated quality of experience of patients and relatives coping in the community.

Surprisingly against a trend of reducing adult mental health beds and discernible pressure against admissions for depression and schizophrenia there has been no reduction in admissions for eating disorders. This could reflect an increase in the numbers of cases presenting with eating disorders or the relative severity of presentations to the NHS has increased over these years. Further research is warranted.
Against a fall in bed numbers for psychiatry and admissions for schizophrenia and depression there has been a significant expansion in NHS admissions for alcohol related disorders. It is not easy to glean from the figures whether these are admissions to general and/or mental health NHS beds. There could be future pressure from general units to reduce these admissions by suggesting transfer to psychiatric management. Psychiatric inpatient capacity probably no longer exists for inpatient alcohol detoxification and dependence. Existing psychiatric outpatient services may not be able to take on board the risk of safely monitoring severely dependent alcohol patients who may have a higher mortality during detoxification. Pressure may arise for a return to district alcohol inpatient units.

Although there is reluctance in the public (and insurance sectors) to pay for inpatient detoxification and dependence services, this situation may have to change to cope with severe effects (physical and psychiatric) on population health associated with alcohol misuse. The increase in admissions so far is a signal for a potential change and may represent an opportunity to plan for new services – both outpatient and inpatient in nature.

Discussion on Future Mental Health policy
Given the relatively permanent nature of the changes wrought by the political strategy (reduction in bed capacity through closure of beds and employment of teams - with intrinsic cost barriers to any redeployment or termination) there is considerable impediment now to any change in direction. Inpatient beds once closed are not easily reopened, inpatient teams are not easily recruited and trained, outpatient teams are not easily redeployed and contracts not easily cancelled.

It is inevitable that psychiatric training will be impacted if NHS opportunities to admit and manage are reduced. If certain types of patients are increasingly being fed into independent sector beds and trainees are focussed purely in the NHS then trainees will never gain the skills necessary to manage these types of patients. Training implications need to be managed, especially if the changes described above are to be permanent.

Should any change of heart occur with regard to inpatient mental health due to media controversy about the state of inpatient facilities or adverse consequences due to failure to admit then the clear strategy of running down inpatient NHS care will be very difficult to halt, let alone reverse.

If a change of heart did occur then parallels could then be drawn to the analogous situation in the 1800s where political will was there to create inpatient settings for the mentally ill, but the public sector could not gear itself up quickly enough. After the County Asylums Act of 1808, the first institution opened its doors in 1811. By 1827, there were still only nine county institutions open, and many patients were being held in jails and treated as prisoners and criminals instead of like mentally ill patients.

There was thus an initial reliance on the independent sector with some attendant media controversy (e.g. the Haydock Lodge scandal of c.1845 where patient mortality was high and legislators, commissioners and providers were one and the same). The role of the independent sector today in providing current spare capacity has been criticised by NHS staff 25. Nevertheless, as the NHS inpatient rundown continues unabated, if there is any change of heart, there must first be a halt in the process. This is not yet apparent. The decline in NHS capacity will therefore continue until any change of Governmental heart occurs, perhaps in response to media controversy. At this point NHS re-gearing will be difficult to achieve quickly enough and probably the Independent sector will be engaged to provide acute inpatient psychiatry for the NHS.
Recent concern expressed by the Royal College of Psychiatrists was intended as a wake-up call for British psychiatry 26 (Craddock et al, 2008). The inexorable and continuing decline in English inpatient mental health indicates that the wake up call has yet to be heard by anybody in charge of the rundown of inpatient psychiatry.

Conclusions

There has been a highly significant reduction in NHS mental health beds in the last decade. This has been associated with a decline in the numbers of admissions of and bed days for a variety of ICD-10 mental disorders. For schizophrenia and depression there has been more marked decline in bed days for female rather than male admissions. The reduction in admissions for schizophrenia, depression and anxiety related disorder were statistically associated with the decline in bed numbers, highly so for depressive episodes and anxiety related disorders.
Admissions for eating disorders seem not to be reducing, perhaps suggesting a change in the epidemiology or detection of eating disorders, and offering an opportunity for further research. The NHS saw significantly increased numbers of admissions for alcohol related disorders, which may have profound implications for the use of a diminishing supply of mental health beds.
If the independent sector growth rate is an expansion rate of 100% per decade then the apparent NHS bed closure may actually represent which there is a switch of inpatient beds directly provided by the NHS to those provided by a smaller independent sector.
The political claim that increased spending on community teams has resulted in a fall in inpatient admissions is probably only partially correct. Barriers to admission and the switch to the independent sector need to be factored in. The overall situation is far more complex and worthy of further epidemiological investigation; particularly before the planned loss of any more NHS inpatient beds.

Professor Ben Green, Consultant Psychiatrist Cheadle Royal Hospital, Visiting Professor of Psychiatry, University of Chester  and Honorary Senior Lecturer University of Liverpool, FRCPsych FHEA MB ChB
Declaration of Interest
Professor Green’s clinical base is Cheadle Royal Hospital, an independent hospital since 1766. The vast majority of Cheadle Royal admissions are funded by the public sector.
Acknowledgements
I am grateful to the staff of HESOnline for helping to compile the figures for 2006-2007 and to Miss E Green for her advice on early drafts of this paper.

References

1.         Goldberg D.(2008)  Improved investment in mental health services: value for money? Br J Psychiatry 200; 192(2) :88-91.
2.         Department of Health. Hospital Activity Statistics. Accessed at various times during 2008. http://www.performance.doh.gov.uk/hospitalactivity/data_requests/index.htm
3.         Health Episode Statistics Online (HESOnline). Database consulted at various times during 2008.  http://hesonline.org.uk

4.         Agresti, A. An Introduction to Categorical Data Analysis, 2nd edn. New York: Wiley & Sons, 1996.
5.         Statistical Analysis System (SAS, SAS Inst., Inc., Cary, NC).
6.         Hansard. The United Kingdom Parliament. Written Answers for 14th December 2006. Accessed August 2008.  http://www.parliament.the-stationery-office.co.uk/pa/cm200607/cmhansrd/cm06214/text/61214w0027.htm

7.      Desai S & Kinton M. Who’s been sleeping in my bed? The incidence and impact of bed over-occupancy in the mental health acute sector. Findings of the Mental Health Act Commission’s Bed Occupancy Survey. Mental Health Act Commission, 2006.
8.         Laing & Buisson. Mental Health Services. Chapter in Laing’s Healthcare Market Review 2007-2008, 2007.
9.         Select Committee on Health, Minutes of Evidence. Memorandum by Independent Healthcare Association, 1999. Accessed August 2008. http://www.publications.parliament.uk/pa/cm199899/cmselect/cmhealth/281/9032505.htm
10.       Jones, A. Assertive Community Treatment: development of the team, selection of clients, and impact on length of hospital stay. Journal of Psychiatric & Mental Health Nursing 2002; 9 (3):261-270.
11.       Glover, G, Arts, G, Babu KS. Crisis resolution / home treatment teams and psychiatric admission rates in England. Br J Psychiatry 2006; 189, 441-445.
12.       Lelliot, P, and Audini, B. Trends in the use of Part II of the Mental Health Act 1983 in seven English local authority areas. Brit. J. Psychiatry. 2003; 182; 68-70.
13.      Lelliott, P. Acute inpatient psychiatry in England. An old problem and a new priority. Epidemiologia e Psichiatria Sociale 2006; 15(2); 91-94.
14.       Santry C.  Inpatient mental health slammed as commissioners neglect services. Health Service Journal 2008. Accessed August 2008. http://www.hsj.co.uk
15        Bowers, L, Simpson A, Eyres, S, Nijman, H, Hall, C, Grange, A, Phillips, L. Serious untoward incidents and their aftermath in acute inpatient psychiatry: the Tompkins Acute Ward Study. International Journal of Mental health Nursing. 2006; 15(4); 226-234.

16.      Bowers L, Nijman H. Aggressive behaviour on acute psychiatric wards: prevalence, severity and management. Journal of Advanced Nursing. 2007; 58(2); 140-149.
17.      Wright, N, Bartlett, P, Callaghan, P. A review of the literature on the historical development of community mental health services in the United Kingdom. Journal of Psychiatric and Mental Health Nursing. 2008; 15(3); 229-237.
18.       Monzani, E, Erlicher A, Lora A, Lovaglio P, Vittadini, G. Does community care work? A model to evaluate the effectveness of mental health services. International Journal of Mental Health Systems 2008; 2:10. Accessed September 2008. http://www.ijmhs.com/content/2/1/10
19.      Joy CB, Adams, CE, Rice K. Crisis intervention for people with severe mental illnesses. Cochrane Database of Systematic Reviews. 2006; Issue 4. Art. No.: CD001087.

20.      Cotton MA, Johnson, S, Bindman J, Sandor A, White IA, Thornicroft G, Nolan, F, Pilling S, Hoult J, McKenzie N, Bebbington P. An investigation of factors associated with psychiatric hospital admission despite the presence of crisis resolution teams. BMC Psychiatry; 2007; 7:52. Accessed September 2008. http://www.biomedcentral.com/1471-244X/7/52

21.      Marshall. M and Rathbone, J. Early Intervention for psychosis. Cochrane Database of Systematic Reviews. 2006; Issue 4. Art. No.: CD004718.
22.      Kapur, N, Hunt I, Webb, R, Bickley, H, Windfuhr K, Shaw, J, Appleby, L. Suicide in psychiatric in-patients in England 1997-2003. Psychological Medicine. 2006; 36 (10); 1485-1492.
23.      Burns, T. Hospitalisation as an outcome measure in schizophrenia. Br J. Psychiatry. 2007; 197; suppl 50; 37-41.

24.      Thompson, A Shaw, M, Harrison G, Verne, J, Davidson, H, Gunnell, D. Patterns  of hospital admission for adult psychiatric illness in England. Analysis of Hospital Episode Statistics Data. Brit. J Psychiatry. 2004; 185(4), 334-341.
25.       Poole, R, Ryan, T, Pearsall A. The NHS, the private sector, and the virtual asylum. BMJ 2002; 325: 349-350.
26.       Craddock, N , Antebi, D, Attenburrow, MJ et al. Wake-up call for British psychiatry. Br J Psychiatry 2008; 193, 6-9.
Copyright Priory Lodge Education Limited 2009
First Published March 2009